

Know how marketing is going without asking anyone.
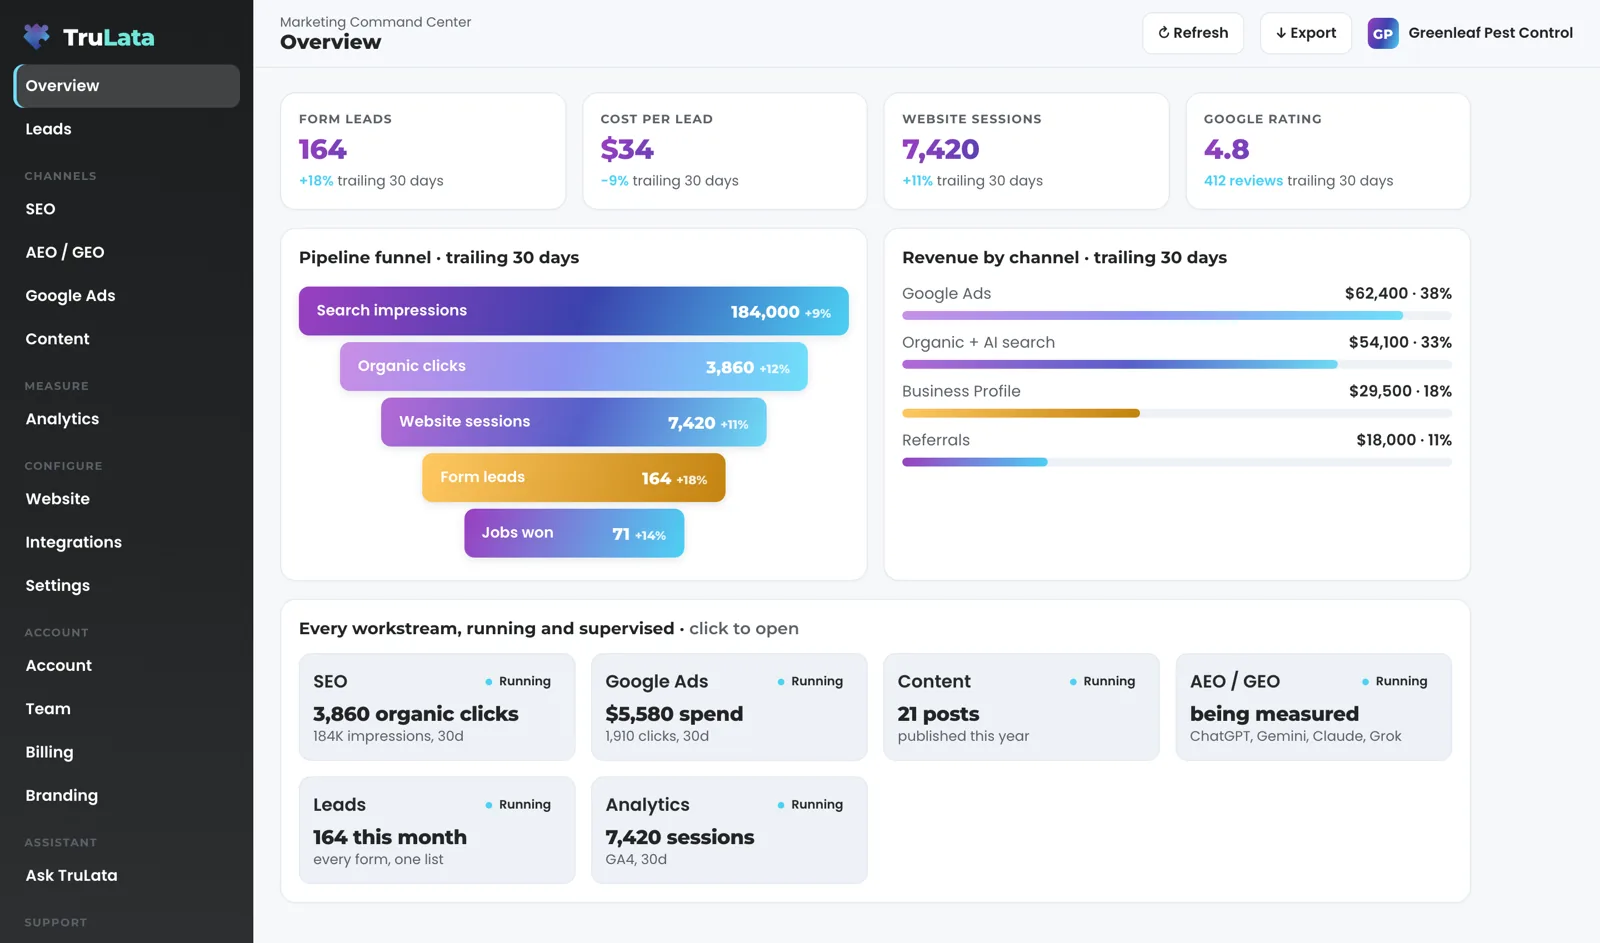
Open the Overview and read leads, sessions, clicks and spend for the window each card names, the funnel from a search to a lead, and what each workstream did last. Click any card and it opens to its source.

Which numbers tell me how marketing is going?
Four cards at the top, each naming its window. Read the value, the change and the window, trailing 30 days on most instances. Which four depends on what your business runs on and what is connected: form leads and cost per lead, website sessions, search impressions and organic clicks, average Google position, Google rating with the review count, ad spend with the campaigns behind it, articles published this year. The four are set with you at setup. Ask for a different one from inside the screen and the request reaches your team as a ticket with a number.
Click a card and it opens to its source. The panel shows the value now, the change, the window, a trend line and a note that names the source in plain words: sessions on your site over the trailing 30 days from GA4, or clicks from Search Console with the impressions behind them. A lead count says which forms it counts. A rating says it is read from your Business Profile. A search figure says Search Console reports two to three days behind, so the newest days are still filling in.
Read the cards against each other. Ad spend beside form leads is the pair to watch: spend up and leads flat is a question, not a result. The ads change watch reads your account's change history and its user list every morning at 7:05 Eastern, sets our own writes and Google's routine churn aside, and raises a material change made by anyone else to your team the same day. A setting switched on under any login, or a new address given access, is on your team's desk the next morning.
Set program goals with us and they sit under the cards. Each goal shows its current number against its target, a bar and a line saying how it is counted. A met goal carries an on-target mark. A goal where lower is better, such as a cost-per-lead cap, reads the right way round: under the cap is on target.
Where do people drop out between a search and a lead?
The funnel shows you, stage by stage. On a service business it runs search impressions, organic clicks, website sessions and form leads. Each stage carries its count, its change and a one-line note on where the count comes from, so a stage that fills without draining is visible without a report. Where your CRM or booking platform is connected and its data is trustworthy, two more stages extend it live: jobs created and jobs won.
The leads stage counts your own forms, read from the sheet they write, rather than an ad platform's estimate. Each submission is appended to a lead sheet on the server, and the Leads view reads that sheet newest first. Where your forms feed that sheet, the lead watch runs every day at 7:20am Eastern and checks the leads that landed against the conversions Google counted, in five checks across the sheet, GA4 and Google Ads. A dead tag, a blind ad account or a stalled form is flagged the next morning rather than at the end of the quarter. That keeps a budget decision on the count your own forms produced.
Revenue by channel sits beside the funnel where the source of each sale is recorded, with revenue and share per channel. The card appears once a source is recorded against your sales, so every bar on it traces to your own record.
From a search to a lead
- Search impressions
- Organic clicks
- Website sessions
- Jobs created, where your CRM is connected
- Jobs won
What ran this week, and what waited for a person?
The bottom of the Overview lists every workstream, one tile each. A tile shows the workstream's name, its headline number, one line on what it does and a Running mark: organic clicks in the last 30 days with the impressions behind them, posts published this year, ad spend in the last 30 days with the clicks it bought. The answer-engine tile reads a score, or being measured before the first run, and names the engines: ChatGPT, Gemini, Claude, Grok, Manus, Google AI Overviews, Perplexity, Meta AI and DeepSeek. Click a tile and its full view opens. A tile arrives with each source as it is connected.
This runs on a schedule whether anyone is at a desk. Prospects are sourced weekly to your target profile. The ads change watch reads your ad account's change history every morning at 7:05 Eastern and reads the account's user list directly, because a change to who has access is not logged as a change event. Our own writes and Google's routine churn are set aside, and anything material reaches your team the same day. The lead watch runs at 7:20. Content moves through queued, researching, writing and draft on your cadence, each topic passing a demand gate on real search volume, and each piece is filed as a Google Doc in your Drive. A fallback snapshot of the whole page bakes at 12:01am Central.
This stays with a person. Budget and bid changes in your ad accounts are made within the limits set for your engagement and land in your account's own change history. Prospect emails leave from a review-first queue; a person releases them, or the queue releases on the schedule set for the engagement, and every send is logged. Replies are classified and shown, and not-interested or bounced addresses are suppressed from further sends. Named priority accounts are always reviewed by a person. Whether content publishes on its own or waits for your approval is a setting on your instance.
What ran this week
- Prospect sourcingTo your target profile
- Ads change watchChange history and user list
- Lead watchLeads against what Google counted
- ContentQueued, researched, drafted, filed in your Drive
- Fallback snapshotThe whole page, baked nightly

This runs on a schedule whether anyone is at a desk.
Where did this number come from?
Click it. A panel opens with the number, its window, its change, its trend and a note naming the source. On the search view, click a keyword and you get its average position in Search Console, its change and its search volume from Google's keyword planner. On the ads view, click a campaign and you get spend, conversions and cost per conversion. Every card, funnel stage and revenue row on the Overview opens.
Export gives you the screen as a file. Press Export in the top bar and the open view downloads as a CSV named for it, trulata-overview.csv on the Overview. It reads the screen itself, so a number refreshed a moment ago exports exactly as displayed. On the Overview the file is the funnel, stage by stage.
The header says how old the data is. A stamp beside the title reads the time the data was pulled. Hover it and it says one of two things: pulled live when you opened this page, or live refresh unreachable, showing the last saved snapshot. Press Refresh and a full pull of every connected source starts, 2 seconds to a little over 3 minutes. The page checks every 3 seconds for the new snapshot and reloads when it lands, or after five minutes with the freshest data that exists, and it puts you back on the view you were reading. Every path through it ends in a reloaded page whose stamp says how old the data is.
Open it at 9am and this is the order. Last night's snapshot loads first as the fallback. The page then asks our service for the live payload, which a warm service answers from cache in about 100 milliseconds, and renders whichever it has. If that payload is older than five minutes, a pull of your sources starts behind the page. When a pull that started on page load lands, the page reloads on its own, but not while you have a panel open or are typing, and it puts you back on the view you were reading. Ten people opening at 9am cause one pull, not ten.
- Click the numberA panel opens: value, window, change, trend and source
- Press ExportThe open view downloads as a CSV, exactly as displayed
- Read the stampPulled live when you opened the page, or the last saved snapshot
- Press RefreshA full pull, 2 seconds to a little over 3 minutes, then a reload
Ten people opening at 9am cause one pull, not ten.
What else can my team open?
The Overview is the first view in the left-hand menu. After it come Revenue and Leads. Then the channels: search, answer engines, Google Ads, content, outbound and email. Then the measurement views, analytics and social. Then the configuration views, website, integrations and settings. Then account, team, billing and branding.
A view appears as its source is connected. A business whose jobs live in a CRM or booking platform gets a Jobs view, and it shows a coming-soon card until the data behind it is trustworthy. The Integrations view lists every source connected to your instance. The Team view shows seats used of plan seats and invites each person by email as a Member or an Admin. Seats are three on Starter, three on Launch, ten on Growth and unlimited on Command. Each person signs in with a single-use magic link from login.trulata.com, and a removed seat stops working within 30 seconds. Branding takes your logo, PNG, SVG or JPG up to 2 MB, and one brand colour.
What writes from the screen is a short list, and each item on it is logged. Set a lead outcome and it writes to the lead record. Request a website change, or a content, keyword, category or targeting change, and it goes to your team, logged and opened as a ticket with a number. The engine's writes to your ad accounts and your site go through their APIs and land in each account's own change history.

How does it connect, and where is the ceiling?
Our team connects it from the inside, with access you grant during setup. Every Google connection, Analytics, Search Console, Ads and Business Profile, is a manager invitation you can revoke in your own console. We never ask for an account password. Your CRM, Stripe, your booking platform, your email platform and your website forms connect the same way, and so does any other system your business runs on with an API. Your part ends with the grant.
Read the ceiling before you buy, because the sources set it. Your CRM, Stripe, your booking platform, website leads and email statistics are live. Google Ads and GA4 intraday figures lag by hours. Search Console runs two to three days behind. Your inbox and your calendar stay private to you, and customer card data stays with Stripe. Phone calls count through your CRM today: a call it records as a lead is on the screen, and a call-tracking platform is connected during setup where your business runs on one. Each tile arrives as its source is connected, so every number on the screen is read from your accounts.
Check four things in the demo. Click a headline card and confirm the panel shows the window and the trend. Click a funnel stage and confirm its count and change open in a panel. Press Export on the Overview and open the file. Send a request from the screen: on the demo it confirms what would go to your team; on your instance it reaches your team with a ticket number. The Refresh button belongs to your instance, where live sources sit behind it; the demo runs on illustrative numbers.
The sources set the ceiling, and the screen states it per source.
What the Overview reads.
| What | Where it comes from | How fresh |
|---|---|---|
| Headline cards | GA4, Search Console, your forms, Google Ads, Business Profile, Stripe, per instance | Live where the source is live; each card names its window |
| Program goals | Targets set with your team at setup | Move with the numbers under them |
| Pipeline funnel | Search Console, GA4, your forms; your CRM or booking platform where connected | Forms and CRM live; GA4 hours behind; Search Console 2 to 3 days |
| Revenue by channel | The recorded source of each sale | Shown once a source is recorded |
| Workstream grid | Each engine's own record | As of that engine's last run |
| Drill-downs | The same sources, one level deeper | Same freshness as the card |
| Export | What the open view shows | As displayed at the moment you click |
Every number on the Overview is read from your accounts, and each card arrives as its source is connected.
Questions, answered.
Can I change which four numbers are at the top?
Yes. The four are set per instance at setup. Ask for a change from inside the screen and it goes to your team as a ticket with a number.
Is the funnel live?
Parts of it. Form leads and CRM stages are live. GA4 sessions run hours behind. Search Console impressions and clicks run two to three days behind, and the note on each stage names its source.
Does every client get every view?
Each view appears as its source is connected. Jobs appears where your CRM or booking platform is connected and shows a coming-soon card until its data is trustworthy, and new views arrive as they are built.
Can my whole team see it?
Yes. Seats are three on Starter, three on Launch, ten on Growth and unlimited on Command. Invite each person by email from the Team view as a Member or an Admin. They sign in with a single-use magic link, and a removed seat stops working within 30 seconds.
Do you send a report as well?
The screen is the report. It refreshes when you open it, the header stamp says when its numbers were pulled, and Export downloads the open view as a CSV you can send on.
Does anything on the screen change my accounts?
Through your team and the engine. A request from the screen goes to your team, logged and ticketed, and the engine's writes to your ad accounts and your site go through each platform's API and land in the account's own change history.
Can I try the Overview before buying?
Yes. Open demo.trulata.com. It runs the same engine code every client runs, on a fictional company with illustrative numbers, and every drill-down opens. It opens without a sign-up.
See how it would run
for your business.
15 minutes with TruLata. We show you what your marketing brings in, what each lead costs, and what we would change first.
Book a demo or start a 7-day free trial
No card. It ends on its own after 7 days unless you add one. See pricing.
New here? See what TruLata is. Prefer to write? Send us the one thing you want to know.
Start here: AI marketing platform · AI marketing software · all-in-one marketing platform · marketing automation software · marketing software for small business.
- Refreshed when you open itLive data on page load, never a monthly PDF
- Counted from your own formsLeads recorded server-side, compared daily with Ads and GA4
- Seen in AI answersHow often ChatGPT, Gemini, Claude, Grok, Manus, Google AI Overviews, Perplexity, Meta AI and DeepSeek name you, measured
- Every send loggedProspect emails leave from a review-first queue, and every send is logged.