See what your social channels are doing, on the same screen as your leads.
Followers, engagement and top posts, read from Facebook, Instagram and your scheduler, beside search, ads and the leads that came in. The view reports; publishing runs through your scheduler with the approval you chose.

What do I see when I open it?
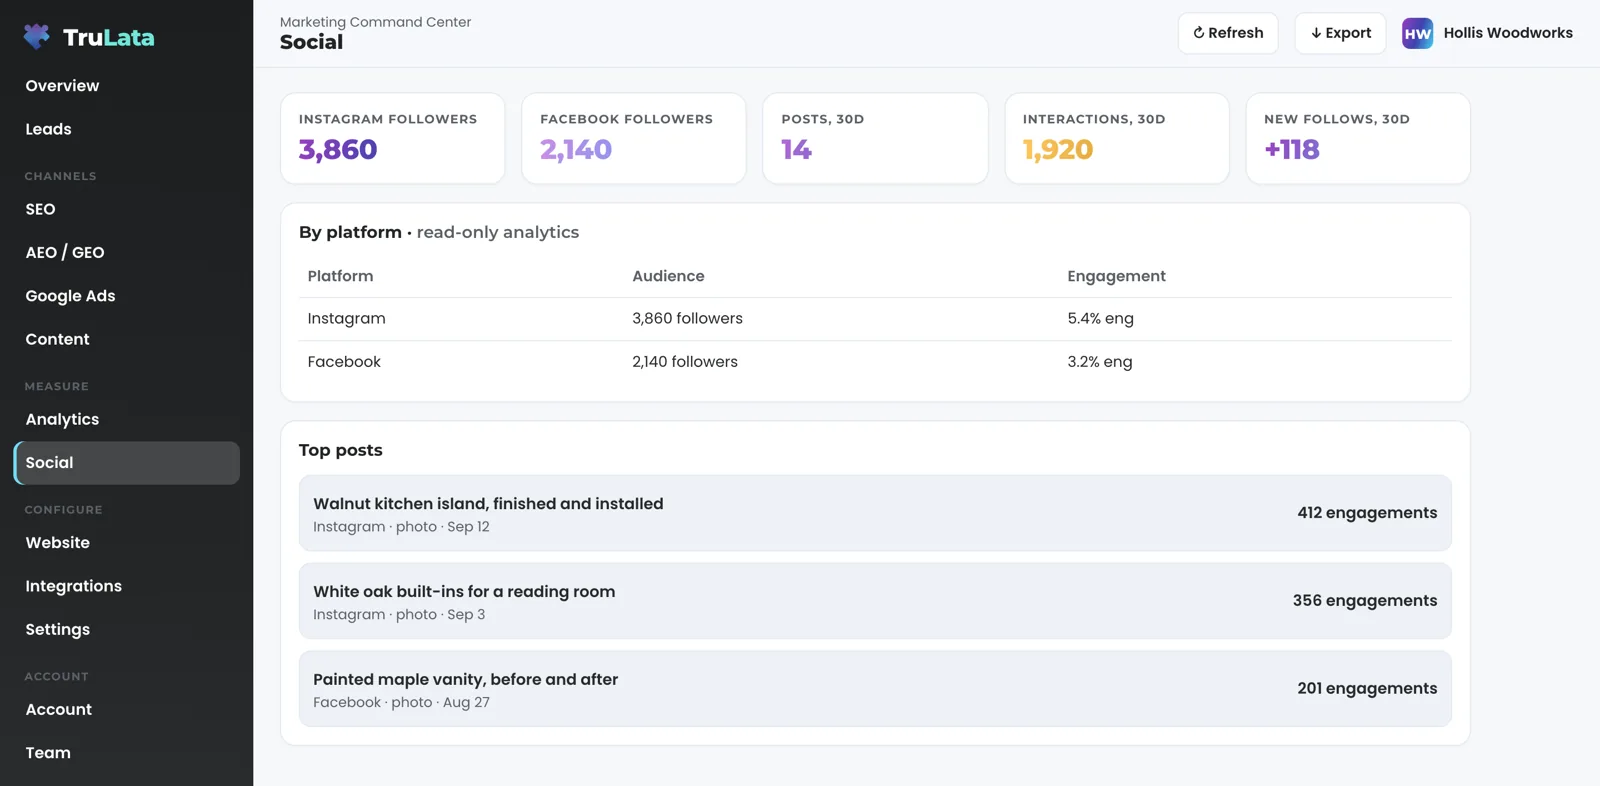
Read the totals first. A stat row sits at the top of the view with the counts you check most. What it holds depends on what is connected: followers per platform and, where your posts go out through your CRM's social planner, posts and post interactions over the last 30 days.
Then read by platform: one row or one card per platform, with its audience and its engagement. The table is labelled read-only analytics on the screen, and it reads a platform whether we post to it, you do, or someone else does. A channel someone else runs still gets its row or card, because the view exists to show the whole picture, not the part we touch.
Where Facebook and Instagram insights are read, each gets a card. The Facebook card carries followers, new follows, post engagements and page views over the last 30 days. The Instagram card carries followers, new follows, views, likes and profile visits over the same window. Each card is badged with where its numbers came from.
A channel with no posts yet is left off the table rather than shown at zero. A row of zeros says a channel is being run badly when the truth is that it is not being run at all.
Social sits under Measure in the sidebar, next to Analytics, and the two are built to be read together. Analytics groups sessions by GA4's default channels, so social traffic is its own line in the traffic-by-channel card, two clicks from the audience you see here.
Which posts worked?
The Top posts card ranks your posts by engagement for the period, each with its caption, its date, its type and its count. What worked sits on the same screen as what Google Ads spent and what came in through your forms, so you read the three together instead of in three tabs.
Where your Instagram business account is connected, the card reads your 25 most recent posts through Instagram's API, ranks them by likes plus comments and shows up to eight. Where your posts go out through your CRM's social planner and that planner is connected, the card reads the planner instead: each published post with its image, its copy, the platforms it went to and its likes, comments and shares, with a count of posts scheduled ahead.
Read the card against the rest of the screen. Say three posts carry most of the period's engagement and all three are photos of finished work. That tells you what to make more of. Then open Analytics: if social sessions rose in the same window, those posts sent people to your site; if social sessions stayed flat, the posts were seen and liked, and the next number is the one to move. Then open Leads and count what came in through your forms, newest first. A post earns its place when it moves the next number along, not when it collects one of its own.
Under the card, one line says how the view runs on your account: who writes, designs and schedules the posts and where each number comes from. On some accounts it also names who approves and when the last post published.
- Top postsThree posts carry most of the engagement, all photos of finished work
- AnalyticsDid social sessions rise in the same window?
- LeadsCount what came in through your forms, newest first

A post earns its place when it moves the next number along.
Does this ever post to my accounts?
The view reports what happened. Publishing, where we run your social, goes through your own scheduling tool under the approval flow you chose, and the screen's own writes are a lead outcome and a request to the team, each logged. Every call the dashboard makes through your Meta access is a read, so your Page changes through your scheduler alone; where we run your ads, the engine's writes go to your ad account through Meta's API and land in its change history.
Every Monday at 9:15am ET a check confirms each Meta token we read through is still valid, is not within 14 days of expiry and has picked up no permission to post to a Page. Anything off goes to our team that morning. If it were ever needed, one switch on our side stops the Meta reads that run through our shared connection at once, with no restart and without touching your Page.
Where we run your social, our team writes, designs and schedules the posts through your own scheduling tool, and approval happens there, not here. Some accounts review every post before it publishes: your named reviewers are told what is waiting in the planner, one notice per batch, and a changed caption, a swapped image or a deleted post is noticed and routed to the person on our team who owns your account. Other accounts use the planner's own approval workflow.
Paid social is a separate screen. Where we build ad creative for you, a per-client Creative view shows each ad with the copy that runs with it and two buttons. Your decision is saved with your note under the name you signed in with. Approving is separate from spending: an approved ad is built, paused, in your Meta ad account from the record of what you approved, and switching it on is its own step. Where a veto window is set for your account, the dashboard states the date, and an ad you have not acted on by then is switched on. Budget and bid changes are made within the limits set for your engagement and land in your account's own change history.
Spend, reach and results from a Meta ad account sit with our team today, read inside our own tools where a Meta ad account is linked, and they arrive on the dashboard as that view is built.
How do I connect a platform?
Share your Facebook Page, and the Instagram business account linked to it, into our Business Manager during setup, alongside the Google manager invitations. Where we already run your Meta ads, that step is done. The access lives on Meta's side, in your Business Manager, where you granted it and where you can withdraw it, and no password changes hands.
Our team links the Page to your business in the per-client map, and the social view appears once it is linked, with your own numbers in it.
Here is exactly what Meta supplies. From the Page: followers, post engagements, page views and post reactions over a 28-day window, plus new follows over a 30-day window. From Instagram: followers, post count, reach, views, profile views, accounts engaged, total interactions, likes, comments, shares, saves, website clicks and new follows. Each metric is requested on its own, so a metric Meta stops publishing is left off rather than allowed to break the pull, and a figure missing from the screen means Meta did not return it.
Two ceilings to know before you buy. Meta retired Page-level reach in 2024, so Facebook reach is not on the organic side of this view; Instagram reach is. And your scheduler holds likes, comments and shares per post, not audience size or demographics, which come from Meta directly.
Meta is read on every account where it is connected, and LinkedIn, TikTok, YouTube and X connect the same way during setup where you run them: the Integrations view lists sources by category and carries a request button, and the request goes to the team and is logged. Where your posts go out through your CRM's social planner, the planner is read as well, whichever platforms it posts to.
What Meta supplies
- Facebook Page
- Instagram business account
- Your CRM's social planner
- Followers, engagement, page views
- Reach, views, profile visits
- Likes, comments and shares per post
How fresh are the numbers?
As fresh as Meta publishes them, and the header stamp says when the data was pulled. Meta is not live. The header stamp says when it was read. Across the dashboard, your CRM, Stripe, website leads and email stats are live; Google Ads and GA4 lag hours intraday; Search Console runs two to three days behind; Meta runs on Meta's schedule.
Follower counts come from the Page and account records themselves, so they are exact at the moment of the pull. Engagement, reach and views come from Meta's insights, which Meta fills in on its own schedule. Likes, comments and shares per post come from your scheduler on each pull.
The dashboard refreshes because you opened it. The page loads last night's snapshot first, fetches the cached live payload instantly, and if that snapshot is older than five minutes a pull runs behind the page. The Refresh button in the topbar starts a fresh pull, which takes from two seconds to a little over three minutes, and reloads the page when the stamp moves. Every path through it ends in a reloaded page whose stamp says how old the data is.
Every night at 12:01am Central a fallback snapshot is baked for every client from one registry, whether anyone is at a desk. A failed pull or a failed syntax check leaves the previous page up, so you always open a full page.
Read the stamp before you read the numbers. A follower count pulled this morning and a post count pulled last night are both on the screen with the time they were read.
When it is read
- Snapshot firstA pull when it is older than five minutes
- A fresh pull2 seconds to a little over 3 minutes, then a reload
- On Meta's scheduleInsights fill in when Meta fills them in
- Fallback bakeA failed pull leaves the previous page up
Read the stamp before you read the numbers.
What should I check in the demo?
Open demo.trulata.com. It opens with your name and email. It runs the same engine code every client runs, for a fictional company with illustrative numbers.
Open Social under Measure and run three checks. First, the stat row and the by-platform table: the demo lists five platforms so you can see the shape of a full table, and a live account lists only the platforms connected on your account. Click a platform row and watch the drilldown open. Second, the Top posts card: three posts, each with its platform and its engagement, ranked. Third, the line under the card that says how the view runs, which on a live account says who posts and where the numbers come from.
Then open Analytics and find social in the traffic-by-channel card, and open Integrations to see how a connected source is listed by category. That is the whole loop this view is built for: what was posted, who saw it, and what it sent to your site.
TruLata and every read-only view in it, the social view included, are on all tiers; the full list of what each tier includes is on the pricing page. The view appears on your account once a platform is connected.
What the social view reads.
| What | Where it comes from | How fresh |
|---|---|---|
| Audience and engagement | Facebook Page and Instagram insights, where connected | Meta's schedule; 28 and 30 day windows |
| Top posts | Instagram's API, or your CRM's social planner where posts go out through it | On each pull |
| Posting | Through your own scheduler, where we run your social, under the approval you chose | Per account |
| Platforms | Meta, LinkedIn, TikTok, YouTube and X, each connected during setup where you run it | Per account |
Every call the dashboard makes through your Meta access is a read, and a check every Monday morning confirms the token still carries no permission to post to a Page.
Questions, answered.
Does the social view post to my accounts?
The view reads audience, engagement and top posts, and every call through the Meta access is a read. Posting, where we run your social, goes through your own scheduling tool under the approval you chose, and where we run your ads, the engine's writes go to your ad account through Meta's API and land in its change history.
Which platforms are read?
Meta on every account where it is connected: your Facebook Page and the Instagram business account linked to it. LinkedIn, TikTok, YouTube and X connect the same way during setup where you run them, and your CRM's social planner is read where your posts go out through it.
Do you read platforms you do not manage?
Yes, where connected. The table is labelled read-only on the screen, whoever posts to the platform.
How fresh are social numbers?
As fresh as Meta publishes them. The dashboard re-reads them when you open it and the snapshot is older than five minutes. The header stamp says when.
Can I approve posts before they go out?
Yes, where we run your social, through an approval flow in your own scheduling tool. That flow is separate from this view.
Is social included on every tier?
TruLata and its read-only views are on all tiers. The social view appears on your account once a platform is connected.
See how it would run
for your business.
15 minutes with TruLata. We show you what your marketing brings in, what each lead costs, and what we would change first.
Book a demo or start a 7-day free trial
No card. It ends on its own after 7 days unless you add one. See pricing.
New here? See what TruLata is. Prefer to write? Send us the one thing you want to know.
Start here: AI marketing platform · AI marketing software · all-in-one marketing platform · marketing automation software · marketing software for small business.
- Refreshed when you open itLive data on page load, never a monthly PDF
- Counted from your own formsLeads recorded server-side, compared daily with Ads and GA4
- Seen in AI answersHow often ChatGPT, Gemini, Claude, Grok, Manus, Google AI Overviews, Perplexity, Meta AI and DeepSeek name you, measured
- Every send loggedProspect emails leave from a review-first queue, and every send is logged.